AI Is Not a Commodity Factor
Artificial intelligence consumes chips, copper and electricity. That does not mean buying copper is the same trade as buying AI.
The distinction matters because a physical input and a financial factor are different objects. AI can raise the long-run demand for electricity and conductive metals while this week’s copper return remains dominated by Chinese manufacturing, inventories, the dollar, mine supply and positioning. A power-equipment stock can capitalise years of expected scarcity rents; a nearby commodity future prices a much shorter and more specific physical balance.
I test that distinction using weekly returns from 2 January 2018 through 31 July 2026. The global panel covers compute leaders, hyperscalers, electrical and cooling firms, generators, miners and investable commodity proxies. A separate China panel covers current AI-chain leaders, Shenwan industries and roll-corrected Chinese futures. The first full trading week after the public release of ChatGPT—2 December 2022—is an exploratory breakpoint, not a causal treatment date.
The short answer is:
The AI trade has broadened through equity claims on scarce physical capacity, but it has not become one common commodity-price factor. The market appears to price who may capture multi-year scarcity rents before it prices a persistent shortage in generic copper or natural-gas benchmarks.
Four results support that interpretation:
- After global market, technology, dollar and interest-rate controls, the weekly correlation between a compute basket and power-equipment equities rises from 0.18 before the breakpoint to 0.35 after it. The corresponding correlation is 0.03 to 0.22 for power generation and 0.17 to 0.27 for copper miners.
- The same compute residual has only a 0.11 AI-era correlation with factor-adjusted copper and 0.01 with natural gas. Neither is statistically different from zero.
- In both the global and Chinese panels, robust copper betas are concentrated in miners and materials. Median AI-era copper betas are 0.03 for global compute, -0.03 for power and cooling, and 0.82 for copper miners. In China they are 0.07 for AI sectors, -0.02 for electrical equipment, and 1.45 for three copper miners.
- A few lead-lag tests look tradable in isolation. Across eighteen declared target-horizon tests, five have unadjusted p-values below 5%; none survives Holm correction. The most attractive four-week copper result also fails alternative-factor, split-sample and non-overlapping-return checks.
This is useful even without alpha. It says that the better AI–commodity question is not “which raw material does AI use?” It is “where is the marginal bottleneck, which security owns it, and has the bottleneck reached the physical balance yet?”
One demand shock, several scarcity prices
AI infrastructure is a sequence of capacity constraints, not a single sector. NVIDIA describes a fabless supply chain that uses TSMC and Samsung for wafers, memory from SK Hynix, Micron and Samsung, CoWoS packaging, and contract manufacturers including Hon Hai and Wistron. That is already several separately priced bottlenecks before a server reaches a data centre. NVIDIA 2026 Form 10-K
The physical chain then extends from servers to uninterruptible power, transformers, switchgear, cooling, grid interconnection and firm generation. The IEA’s 2026 update expects global data-centre electricity consumption to rise from about 485 TWh in 2025 to 950 TWh in 2030, with AI-focused data-centre consumption growing much faster than the total. The earlier detailed study estimates that grid constraints could delay roughly 20% of planned data-centre capacity through 2030. IEA 2026 update, IEA energy-security analysis
The materials link is real as well. Data-centre construction requires copper, aluminium, silicon, gallium, rare earths and battery minerals. Yet materiality to a project is not necessarily materiality to the global commodity balance. Total copper demand was about 26.7 million tonnes in 2024, spread across construction, grids, transport, machinery, consumer goods and other uses. IEA copper outlook
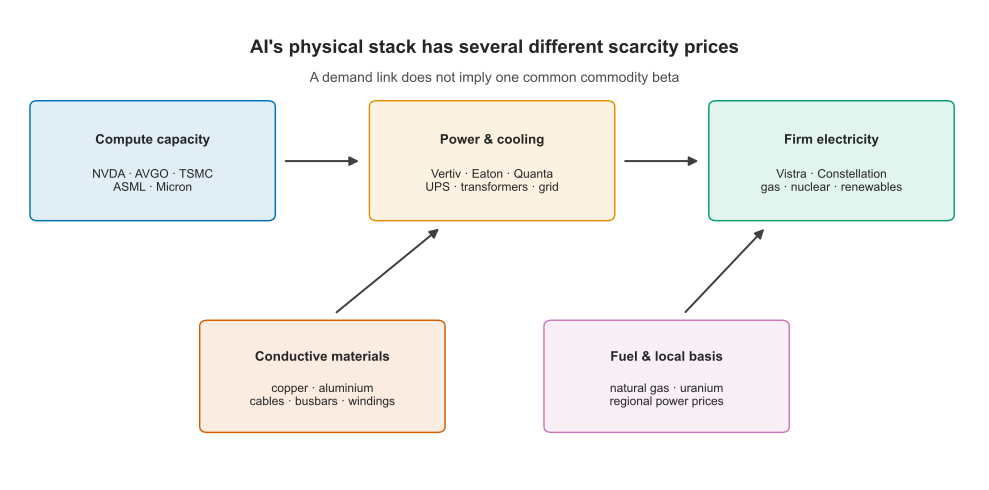
This map suggests three different claims on the same demand shock:
- Compute equities are claims on intellectual property, manufacturing access and uncertain future adoption. Technology-revolution valuations can rise with uncertainty about future profitability and adoption, not just with current cash flow. Pástor and Veronesi
- Infrastructure equities are claims on backlogs, installed capacity, pricing power and the option to expand capacity over several years.
- Commodity futures are claims on a dated physical balance. Storage, inventories, convenience yield, currency and the futures curve matter. The empirical commodity literature finds that inventory conditions are central to commodity risk premia. Gorton, Hayashi and Rouwenhorst
That duration mismatch is the main asset-pricing hypothesis. An equity can respond today to a shortage expected in 2029. A storable commodity responds more strongly when that expected demand begins to compete with available inventory and near-term supply. Electricity is even more local: the scarce object may be a specific interconnection queue or regional power basis, neither of which is captured well by a national natural-gas ETF.
Research design
The global universe contains five compute names—NVIDIA, Broadcom, TSMC, ASML and Micron—alongside Microsoft, Amazon, Alphabet and Meta; Vertiv, Eaton and Quanta Services; Constellation and Vistra; Freeport-McMoRan, Southern Copper and Cameco; and relevant sector ETFs. CPER and DBB are the principal copper and base-metal measures. UNG, USO and GLD provide natural-gas and placebo exposures. Front-month copper futures appear only in robustness tests because a free continuous series can contain roll artefacts.
The China universe contains Cambricon, Hygon, Zhongji Innolight, Eoptolink, Foxconn Industrial Internet, Inspur, Wus Printed Circuit, Victory Giant, Envicool, Kehua Data and Kstar. Zijin Mining, Jiangxi Copper and CMOC are producer controls. Sector tests use Shenwan Electronics, Computer, Communication, Electrical Equipment, Utilities and Non-ferrous Metals. Chinese copper, aluminium, gold and crude-oil futures use the actual mapped main contract on switch dates, preventing calendar spreads from appearing as returns.
Global weekly exposure regressions are
\[ r^i_t=\alpha+\beta_m r^{SPY}_t+\beta_g(r^{QQQ}_t-r^{SPY}_t) +\beta_{\$}r^{DXY}_t+\beta_r\Delta y^{10y}_t+\beta_c r^{commodity}_t+\varepsilon_t. \]China replaces those controls with the CSI 300 and ChiNext-minus-CSI-300. Newey–West standard errors use four weekly lags, and p-values are Holm-adjusted within each commodity and regime. For the cross-layer test, each equal-weight layer is first residualised on the same controls within each subperiod.
This is an exposure study, not a clean cross-sectional test of expected returns. The current-leader universe is selected with end-of-sample knowledge, so it is useful for diagnosing co-movement but not for estimating an unbiased historical AI premium. The ChatGPT breakpoint is similarly interpretable but ex post.
Copper beta stops at the producer
If copper were already a broad AI factor, compute, electrical equipment and power stocks should retain positive copper betas after market and style controls. They do not.
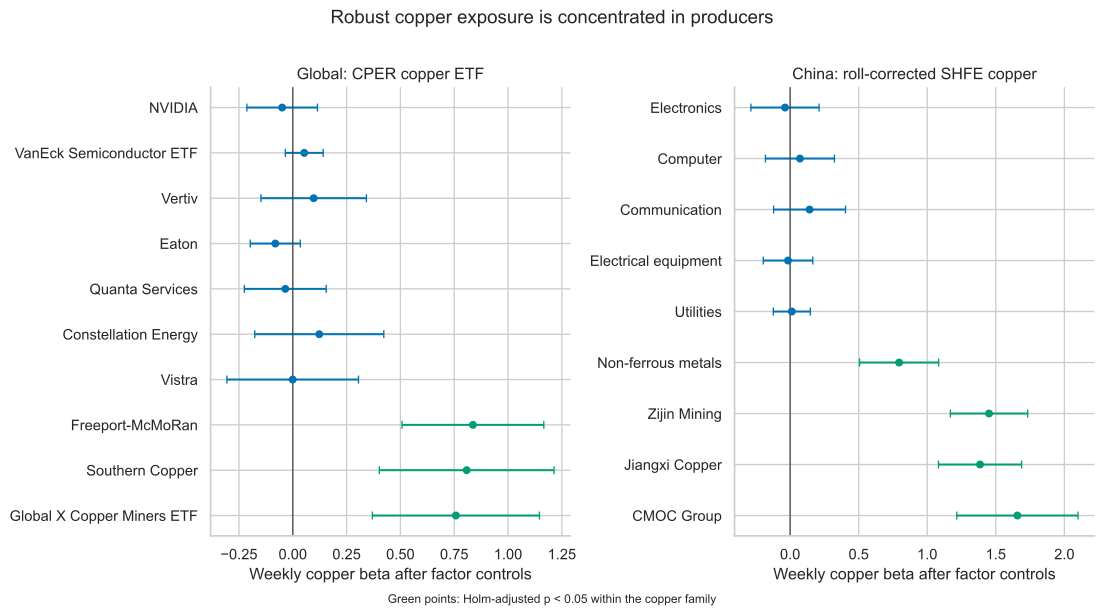
The cross-market comparison is unusually clean:
| Market | Layer | Median copper beta | Interpretation |
|---|---|---|---|
| Global | Compute | 0.03 | No generic copper exposure |
| Global | Power & cooling | -0.03 | Equipment backlog is not copper beta |
| Global | Power generation | 0.06 | National copper is not the power bottleneck |
| Global | Copper miners | 0.82 | Direct output-price exposure |
| China | AI sectors | 0.07 | Broad AI industries are not copper proxies |
| China | Electrical equipment | -0.02 | No conditional copper exposure |
| China | Utilities | 0.01 | Fuel mix and regulation dominate |
| China | Non-ferrous metals | 0.79 | Direct sector exposure |
| China | Copper miners | 1.45 | Levered producer exposure |
The null results do not say AI uses no copper. They say that weekly AI-chain equity returns are not behaving like disguised copper positions. That is exactly what should happen if copper is one input among many, firms can pass through costs, and the global copper price is still set by a much broader demand system.
The same logic applies to natural gas. The IEA expects gas to be an important source of additional US data-centre electricity through 2030, but data-centre demand is geographically concentrated while Henry Hub is national. IEA energy-supply analysis A Virginia interconnection constraint can create valuable generation or transmission capacity without producing a clean weekly beta to UNG.
The AI factor broadens through equities
The commodity result does not imply that the physical story is absent from asset prices. It appears elsewhere.
After removing the broad global factors, compute co-movement with power equipment, power generation and copper miners is stronger in the AI-era sample. Copper and base metals barely change, and natural gas remains near zero.
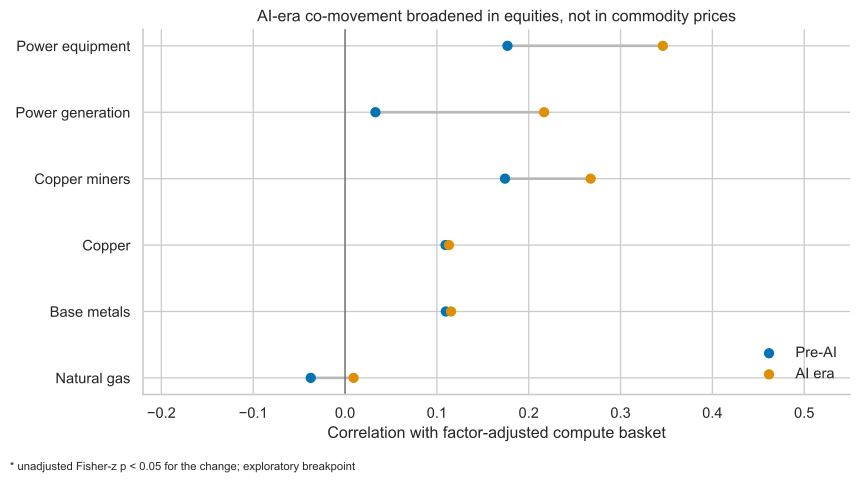
The post-breakpoint levels are informative even though the changes should not be over-sold. Compute residuals have correlations of 0.35 with power equipment, 0.22 with power generation and 0.27 with copper miners; all three post-period correlations are individually significant. The corresponding values are 0.11 for copper and 0.01 for natural gas, both insignificant.
This looks less like a commodity factor and more like a scarcity-rent equity network. Equity investors can revise the present value of transformer backlogs, data-centre cooling demand, generation capacity and mine-development optionality at the same time that they revise compute demand. Commodity markets need not move unless the revised demand changes the nearer physical balance.
There is a second clue in the cross-section. After removing the broad technology factor, compute and hyperscaler residuals are negatively correlated: -0.34 in the AI era. A favourable shock for suppliers can be an unfavourable shock for buyers if it represents higher capex, tighter capacity or a transfer of rents upstream. “AI exposure” therefore has no universal sign. The owner of the bottleneck and the buyer of the bottleneck are different trades.
Recent work using 2023–2025 returns similarly finds that data-centre infrastructure is more informative for energy equities than a direct AI-technology index. The important extension here is that the link does not carry through mechanically to generic commodity prices, and it is much weaker in the China sector panel. Cheema-Fox, Czasonis, Kontu and Serafeim
In China, factor-adjusted AI-sector returns have AI-era correlations of -0.23 with Electrical Equipment, -0.10 with Utilities and 0.07 with Non-ferrous Metals. Broad Shenwan sectors are imperfect pure plays, but the contrast is still a useful warning: a US AI-infrastructure factor should not be exported mechanically to another market with different firms, regulation, power pricing and investor segmentation.
The tempting alpha does not survive
A contemporaneous network is not a trading rule. To test delayed diffusion, I use the current factor-adjusted compute return to predict one-, four- and twelve-week forward abnormal returns for power equipment, power generation, copper miners, copper, base metals and natural gas.
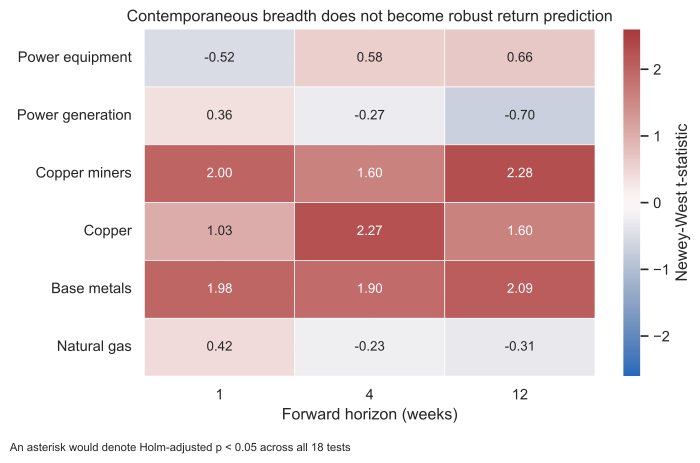
The four-week copper coefficient is the seductive result. In the main specification, a 1% compute residual predicts about 0.40% of cumulative CPER return over the next four weeks, with a t-statistic of 2.16 and p-value of 0.031. A factor-adjusted version produces a similar t-statistic of 2.27.
It fails the audit:
- Across the declared eighteen target-horizon tests, its adjusted p-value is 0.41.
- Replacing the Nasdaq-minus-market control with a growth-minus-value control reduces the t-statistic to 1.20; using only the market reduces it to 0.83.
- In the second half of the AI-era sample, the t-statistic is 1.01.
- Four non-overlapping calendar offsets produce t-statistics of 0.93, 2.66, 1.57 and -0.39. One lucky offset carries much of the appearance.
- NVIDIA alone has the wrong sign. The result is stronger in the broader semiconductor basket, which makes a traditional semiconductor-cycle signal at least as plausible as an AI-demand signal.
That is a watchlist item, not alpha. It may become more interesting with a pre-registered horizon, genuine real-time constituents and a physical scarcity state. It is not strong enough to support a backtested trading claim today.
A better signal would condition on scarcity
The empirical results point to a more precise hypothesis:
\[ E_t[r^{commodity}_{t+1:t+h}] \;\propto\; \text{AI demand surprise}_t \times \text{physical scarcity state}_t. \]An AI demand surprise should matter more for copper when exchange inventories are low, the curve is backwardated, mine disruptions constrain supply, or fabrication capacity is tight. It should matter more for electricity when the data centre sits behind a congested node, interconnection queues are long, reserve margins are low, and firm generation cannot be added quickly. Without the interaction, an AI return shock is easily overwhelmed by the rest of the commodity market.
This suggests a practical hierarchy for future research:
- First identify the unit of scarcity: CoWoS capacity, HBM, transformer lead time, firm megawatts, grid connection, copper inventory or regional power basis.
- Match it to the security that owns the rent. A producer, an equipment supplier, a regulated utility and a commodity future are not substitutes.
- Measure the physical state before looking at returns. Term structure, inventory, backlog and location should be conditioning variables, not post-hoc stories.
- Use earnings or capex news to build a real-time AI-demand shock, then test it out of sample across both equity and physical markets.
The most promising cross-market trade may therefore be less glamorous than “long AI, long copper.” It may be a conditional relative-value trade: long the owner of a locally binding bottleneck, short the buyer or the broad factor, only when physical evidence confirms scarcity.
What the evidence changes
The physical AI thesis is not wrong. It is too aggregated.
Global data-centre demand is large enough to change power investment, corporate capex and the valuations of firms that own constrained capacity. The US Department of Energy estimated data centres at 4.4% of US electricity use in 2023 and 6.7–12% by 2028; its newer work keeps the range wide because efficiency, deployment and supply are all uncertain. US Department of Energy
But a large end-use forecast does not automatically create a clean commodity factor. Equity claims and commodity contracts have different durations, locations and state variables. In this sample, the market prices the AI physical stack most clearly through the equities that may own its scarcity rents. Copper miners still trade like copper miners. Power assets increasingly trade with compute. Copper and natural gas themselves remain mostly copper and natural gas.
That is the insight: follow the bottleneck, not the brochure.
Data: Yahoo Finance adjusted prices and Tushare daily data. The analysis is descriptive and exploratory, not investment advice. Full code, asset definitions, derived tables and robustness results are in the repository.